Task Analytics Charts - Task Management Solution
CentriQS analytics lets you work with and collect large sets of data, but that data is useful only when you can clearly communicate what it means. In order to put together a good task management chart you need to show the relationship and comparison of data elements, as well as distribution and composition of data. CentriQS task analytics chart view provides all available chart types, styles, and methods of presenting information for you to select the best way of displaying your task analytics data.
Learn how to use Task Charts
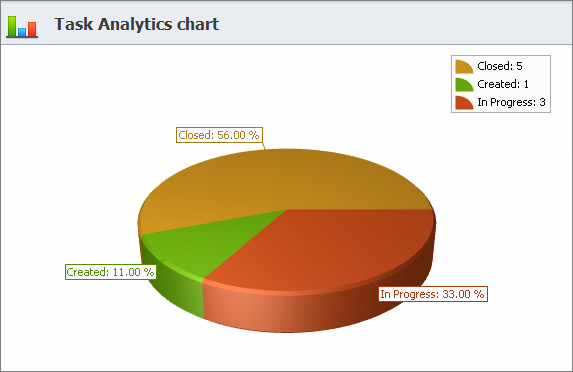
What is Task Analytics Chart?
Task analytics chart is a graphical representation of task analytics data for better and quicker understanding of large data sets and relationships between different data items. You can open Task Analytics Chart view from Analytics & Reports section in the Go To option.
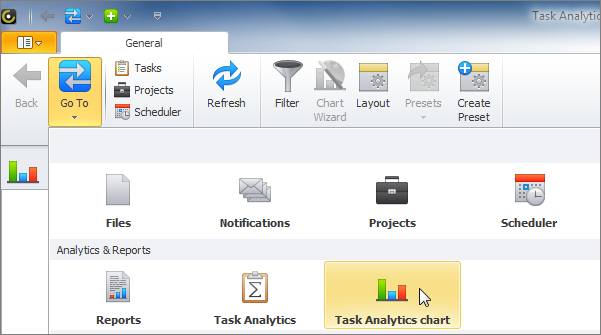

Task Analytics Chart view uses Task Analytics OLAP cube as data source for building task management diagrams (the same way as Task Analytics View uses this cube for building Pivot table which also has a built-in chart that visualizes data in selected table cells).
Chart Layout
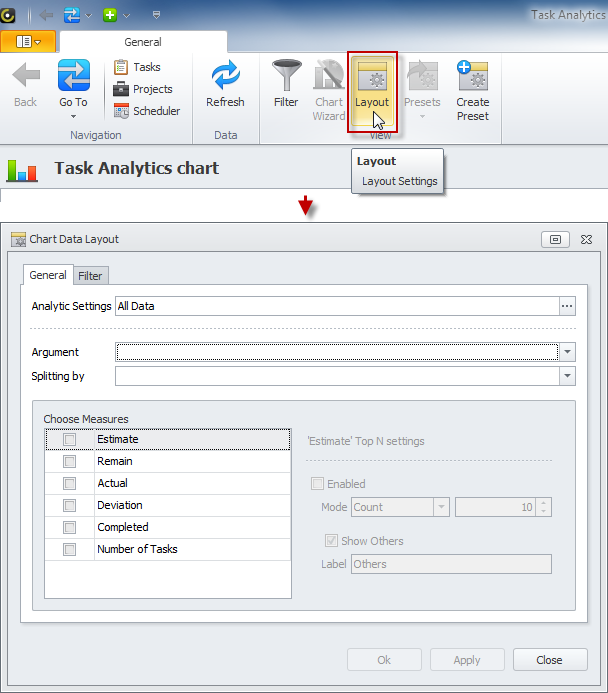
You need to set Chart Layout to specify what data will be shown in the chart and how it will be displayed. Chart Data Layout window opens when you click the ‘Layout’ button in the ribbon and includes settings which define the content of the chart as described below.
Analytic Settings
Analytical settings are specified in the Data Source Settings window. Default Base Field is ‘Changing Date’ which records date and time of any task changes. Base Field is recommended to be left as is, still if there is a need you can choose another field from the drop down list (base field can be any task property of ‘DateTime’ data type which is added as a field to Task Analytics OLAP cube).
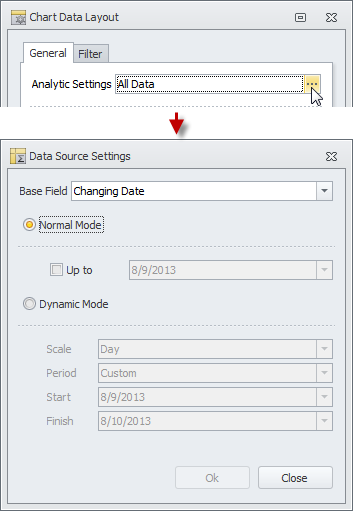
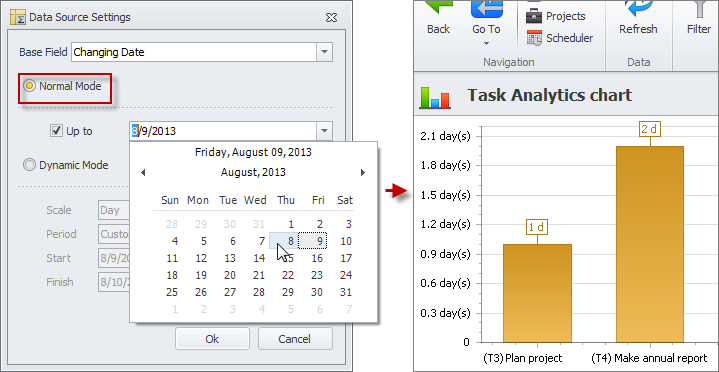
Normal Mode means that chart will show the data for that very moment (up to now). If you need the chart to show the data which was true for a certain date in the past, you need to check the ‘Up To’ option and select the required date in the date picker. For example, you can create time tracking chart to see how much time remained till task completion yesterday.
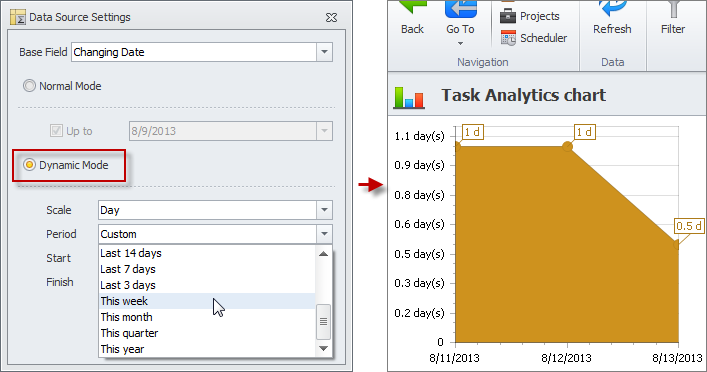
Dynamic Mode means that chart will show how data changed in the certain historical period (dynamics of changes). You need to choose a scale (day, week, month, quarter or year) and a period which can be relative (this week, last month, etc.) or custom (with a certain start and finish date). For example, you can make task progress chart to see how time remained till task completion changed this week.
Argument
In ‘Argument’ option you select the task property which is used for dividing the chart data. Usually argument follows the preposition “per” or “by” in your chart title. For example, resource allocation chart “Number of Tasks per ASSIGNED USER” has task property ‘Assigned To’ as its argument and shows the quantity of tasks allocated among assigned users.
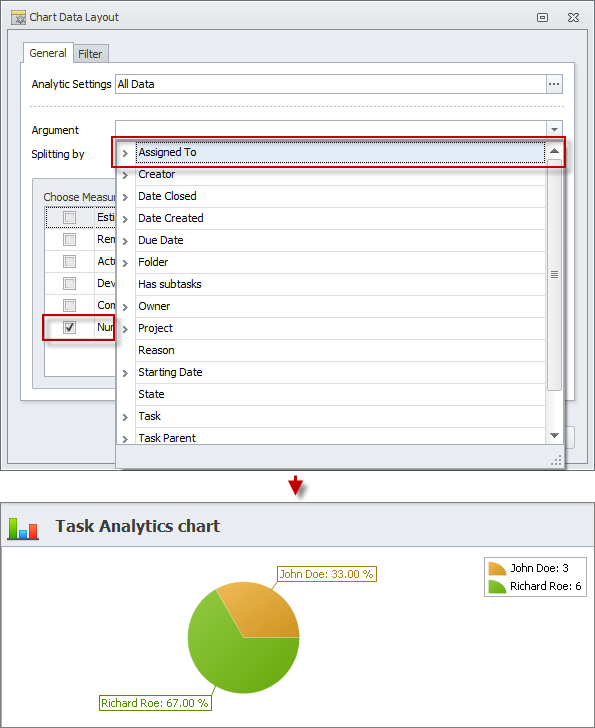
Note that when you select Dynamic Mode in Analytic Settings, Changing Date automatically becomes chart argument.
Splitting By
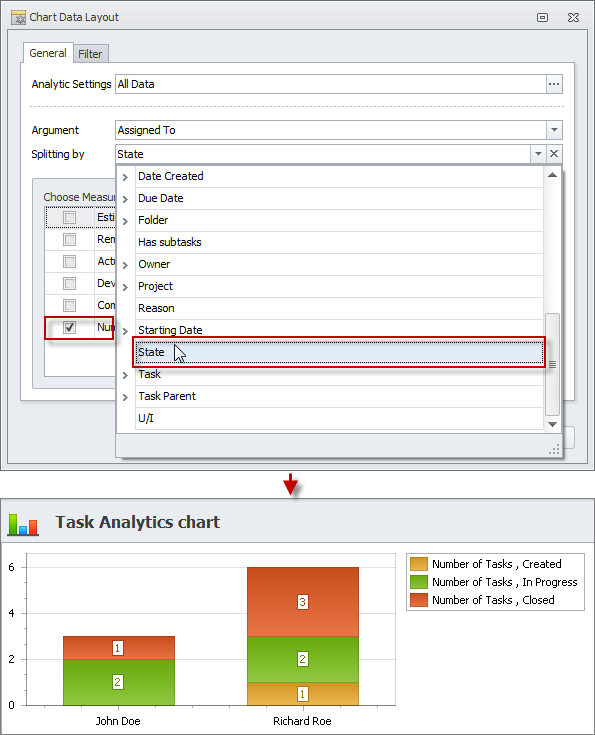
In ‘Splitting by’ option you can select the task property which is used to additionally divide the chart data divided by argument. For example, if you want to see how many tasks assigned to users are in particular state, you can open the layout of chart “Number of Tasks per Assigned User” and select the task property ‘State’ for ‘Splitting by’ option.
Choose Measures
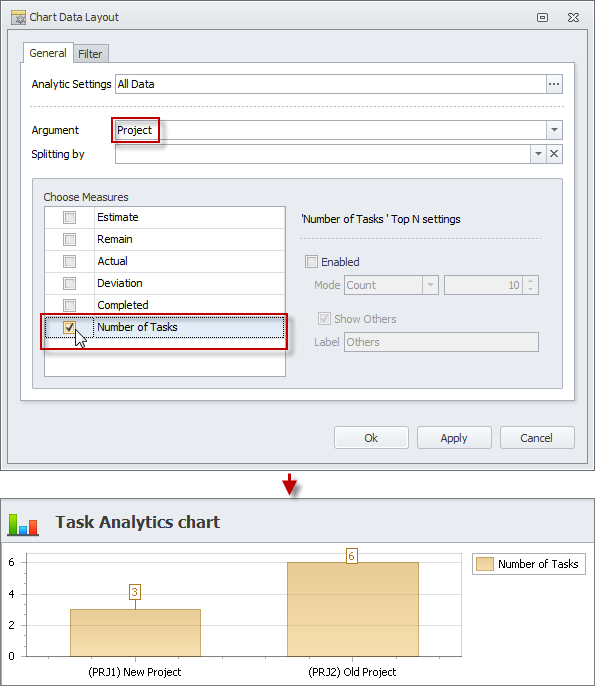
In ‘Choose Measures’ option you select the task property or properties which data will be shown in the chart. The list of measures is built automatically based on Task Analytics OLAP cube fields of ‘measure’ type. By default there are 6 measures: Estimate, Remain, Actual, Deviation, Completed, and Number of Tasks. For example, of you check “Number of Tasks” measure and select “Project” as chart argument, you will see how many tasks are there in each project.
Top N
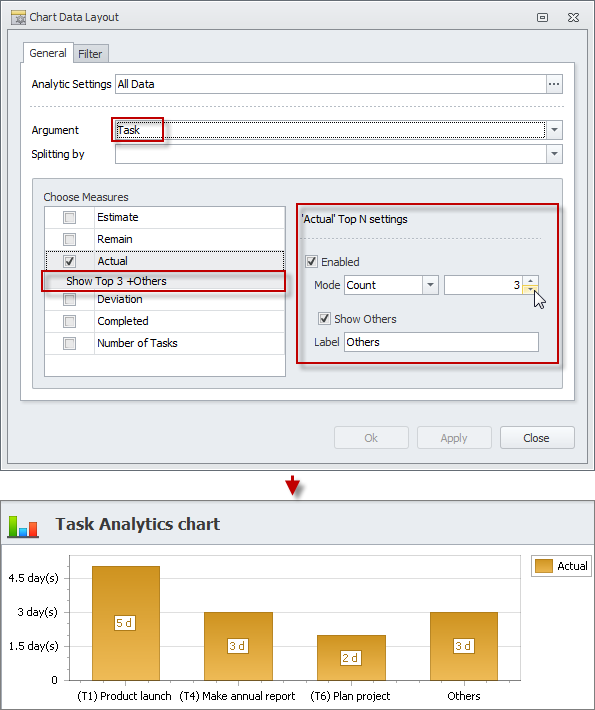
In ‘Top N’ options you can select how many items of chart argument to display in the chart. For example, if you would like to see three tasks on which users spent the most of their time, you can check “Actual” measure and select “Task” as chart argument.
Filters
‘Filters’ option lets you set required filter condition to display only necessary information in the chart. For example, if you set filter to display only closed tasks you will get employee performance chart “Number of COMPLETED tasks per assigned user”.
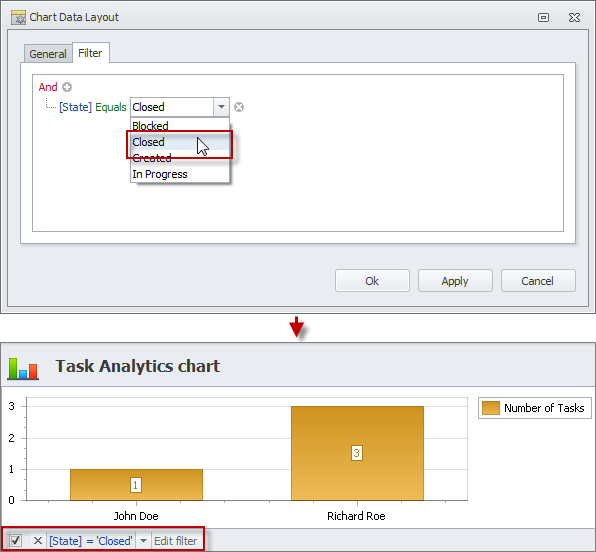
Chart Wizard
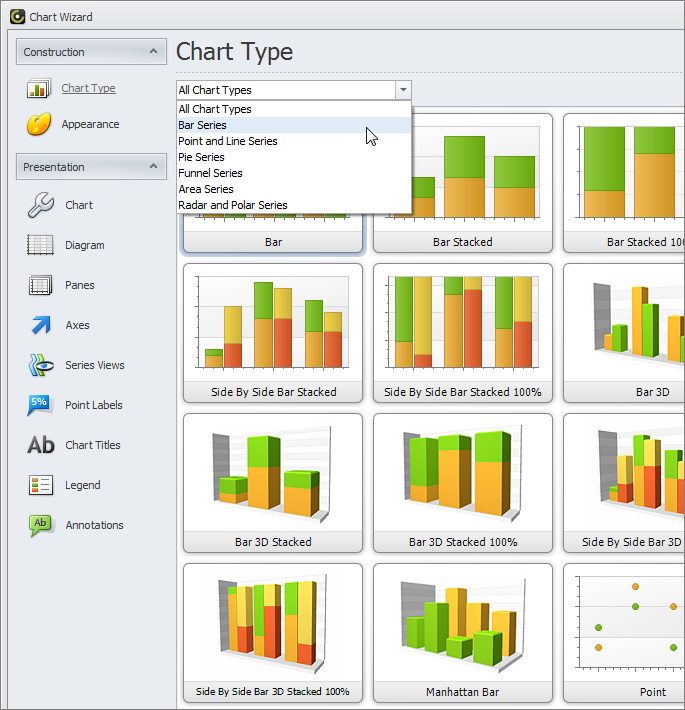
Once you’ve set the chart layout, you need to work over its design so that anyone can understand what message the data is trying communicate. It can be a confusing and difficult task, so Chart Wizard helps you design chart appearance at ease. You can open Chart Wizard by clicking the ‘Chart Wizard’ option in the ribbon of the view or in the context menu of the chart.

While designing your task analytics chart you should make sure your chart (ex.: time management chart, workload chart, etc.) is focused on the data you want to present, you selected the right type of chart, no element distracts users from the critical information, title is short and clear, axes are labeled properly, and so on. Chart Wizard lets you follow all the mentioned tips, and much more:
- Choose the most suitable chart type from Bar, Point and Line, Pie, Funnel Area, Radar and Polar series
- Select the color of chart, its background and border
- Design point labels, chart titles, legend and annotation
- Rotate the chart, display or hide the axes, set margins, etc.
Learn how to use Chart Wizard
Prev.: Task Analytics View || Next: Task Dashboard
Next steps
{
Check out Task Management FEATURES
Watch Task Management Solution VIDEO OVERVIEW
Learn how to manage tasks in KNOWLEDGE BASE
DOWNLOAD CentriQS 30-day Free Trial Version
CONTACT US to get help with Task Management Solution